 | ||||||||||||||
|
|
2.3 - KPI's of Financial Performance by Segment 2.3.1 - Accounting Result The accounting result by segment is calculated by subtracting the direct and indirect expenditure to the income generated by the segment. The indirect costs for each segment are calculated using allocation keys, or using the absorption model (Simões, 2001). According to Simões (2001), this model has several shortcomings in the assessment of financial performance:
2.3.2 - ROI - Return on Investment ROI - Return on Investment was developed by Du Pont in the 20s of the twentieth century, with the aim of measuring the efficiency of commercial enterprise and its business units (Simões, 2001). This indicator aims to compare the output generated by a segment with the level of invested capital, resulting from economic assets allocated to the segment. It is calculated using the following formula (Jordan et al., 2007): 
This indicator assumes that financial resources are scarce and have an expense. As this principle applies to the company as a whole, as it allows us to identify a minimum return to shareholders and creditors, its extension to multiple threads will not be simple (Jordan et al., 2007). The diagram below shows how ROI is affected by changes in operating results (via the return on sales) or the elements of balance sheet (via the rotation of sales) (Simões, 2001): 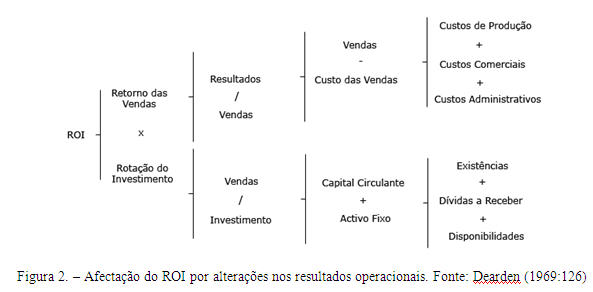
The use of ROI, to assess the results of segments, a single number can reflect all the factors that affect the economic situation of the segment, however, presents the following disadvantages:
2.3.3 - EVA® - Economic Value Added EVA® measures the difference between the return on capital and cost of capital. EVA ® indicates a positive value creation for shareholders of the company and a negative EVA ® means value destruction. The main difference of EVA ®, compared to traditional measures of income, is that consider the total cost of capital and not just the interest. Proponents of the application of EVA ® argue that any measure of performance evaluation that ignores the cost of equity capital does not demonstrate the success of an enterprise to create value for its owners (Young, 1997). EVA ® can give to investors and managers which areas of the business was created or destroyed value, since it can be used to measure the performance of any enterprise level and not only in its entirety. EVA ® can be used to communicate the performance of the company both externally and internally (Young, 1997). EVA ® is calculated as follows: 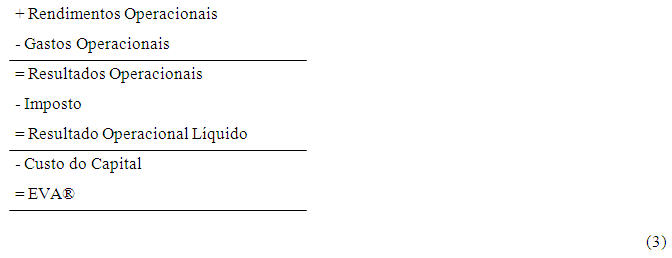
According to Young (1997), EVA ® lets you combine three elements that no other measure of capital could:
The advantage of evaluating the performance of managers and apply bonuses based on EVA ® is that your success is to be connected directly to the shareholders, leading them to think and act like owners. Not being dependent on EVA ® accounting standards, still has an important advantage for the clearance of compensation, since it reduces the incentive to manipulate accounting results (Young, 1997). EVA ® can overcome some of the limitations outlined in the indicators presented above, not only by considering the cost of capital, but also because it obligatory regardless of investment is positive or negative. Improving the value of EVA ® does not only depend on the increase in turnover (highest income), depending also on cost-cutting and even the management of economic assets, penalizing businesses that use high levels of investment or underspends of them (Jordan et al., 2007). EVA ® has full applicability in the evaluation of economic performance and financial segment, such as the profitability of customers, markets, distribution channels, projects, or others. This indicator incorporates all factors that contribute to value creation, including the capital employed, even to an analysis by segment (Jordan et al., 2007). Although not a new concept, EVA ® gained popularity in the 90s of the twentieth century, due to registration of the acronym EVA ® by the company Stern Stewart & Co. and its associated advertising (Simões, 2001). 2.3.4 - Residual Income (MCR - Margem de Contribuição Residual) This indicator is intended to assess the degree of contribution of each segment to create enterprise value, based on a fee charged by the financing of economic assets used by him (Jordan et al., 2007). This indicator is obtained as follows: 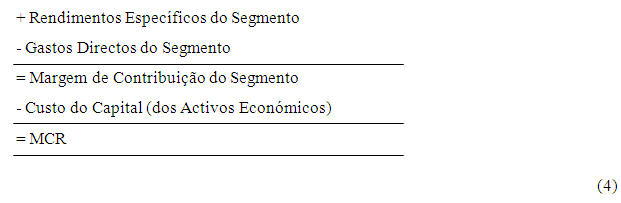
MCR is very similar to EVA ®, differing in the following points:
MCR has all the advantages of EVA ®. Ignoring the tax, the MCR is best suited to analysis of segments, since it would not be possible to calculate the tax for the most elementary segments. The tabulation of results by the logic of the contribution simplifies the process of verification of results and provides higher quality information for decision making (Simões, 2001). 2.3.5 - Conclusions EVA® vs Accounting Result 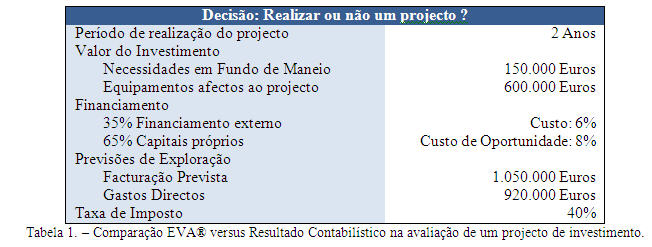

As shown in the example, the positive result is not sufficient to compensate the investor for the risk assumed, not covering the opportunity cost of capital. A positive accounting income does not warrant the creation of value for the investor. 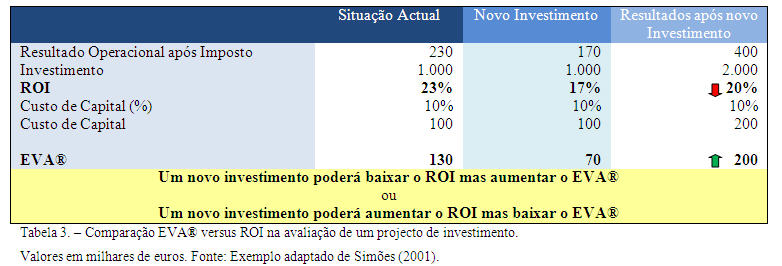
The new investment has a negative impact on ROI, however, creates value for the investor to the extent that the opportunity cost (10%) is below the payoff (17%). An investment analysis performed only using the ROI would lead to decision not to make the investment. Like the accounting result, ROI can also lead to decisions contrary to the interests of the investor. Conclusions According to the above, we conclude that EVA ® and MCR are the indicators that are best suited to assessing financial performance by segment because (Simões, 2001):
|
|
||||||||||||

nunofonseca.com - All rights reserved.