 | ||||||||||||||
|
|
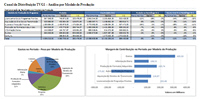
4 - The New Age of Television 4.1 - Guidelines This work is not the main aim of exhaustive study of the evolution of television and its future. It would not, however, possible to address issues such as management control in television or the assessment of financial performance, without understanding the current context of the sector, which crosses a unique dynamic in its history. This study would be reduced in their interest to look only to the past. This chapter is a summary of key trends, drivers of change and introduce a future vision for the industry response to address the new context. The aim is then to guide the management models proposed in this paper for the future, responding to new information needs to management. The U.S. has been pioneers in the implementation and adoption of many technologies. In the television industry are no exception. With a few studies on this market, we intend to analyze trends and behaviors that may result in other markets, including Portuguese. 4.2 - The new context: Technological change and Consumer Behavior 4.2.1 - Introduction Technological change has transformed the global environment of the industry average. In a medium organized around a passive consumption of average spent for a much more complex - mobile, multitasking and on-demand (Gluck and Sales, 2008). The increased capacity and low cost of digital storage (hard drives and other components), the Internet and the exponential increase in network bandwidth, the digital television and IP-TV, the evolution of mobile telecommunications networks, among others, came transform the way of consuming video. It is now possible to store many hours of video on a PC, media player or digital video recorder (DVR). The broadband networks also allowed to distribute video in a way unthinkable a few years ago. Any mobile phone is now an equipment capable of producing or consuming video. Technological developments led to a convergence between the sectors of media, information technology, telecommunications and consumer electronics. In terms of video content is now possible for consumers to choose what you want to see, when you want to see and how you want to see. 4.2.2 - Change Factors Multi-platform - Video consumption on multiple platforms Consumers no longer have the TV as the only equipment to access video content. The computer, mobile phone or even game consoles and portable media devices, are now vulgarizados equipment in the access to this content, however, the TV remains the main consumer equipment. With distribution across multiple platforms, accessibility and more content, the consumption of video records the highest levels ever. Despite the consumption of video over the Internet or phone is booming, the time spent watching television has changed considerably, ie, each time it consumes more video and new platforms are not cannibalized the television. In the U.S., according to the study by Nielsen (2009a) on the video consumption in the third quarter of 2009, on average, every American has seen 31 hours of television per week, of which 32 minutes using the DVR consumed 4 hours / week of video over the Internet and via mobile phone 3 minutes. In the case of average consumption per capita and video since the use of Internet or mobile phones do not have the penetration of close to 100% as the TV, these figures mask some important data. Of the approximately 290 million U.S., about 140 million consuming video over the Internet, an average of 3:24 a.m. per month, representing a growth of 35% over the same period of 2008. Regarding mobile phones, only 6% of users of video equipment consumed during the study period, or approximately 15 million individuals. However, this number has grown by 50% compared to 2008 and every consumer of video over mobile saw an average monthly 3:15 a.m.. It also noted the asymmetry of consumption among the 12-17 age group, where each individual has seen an average of about 7:13 a.m. video on your phone. With regard to television viewing timeshifted, ie using DVR - digital video recording - in the quarter reviewed, there were about 86 million users, and there was an increase of 27% over the same period in 2008. On average, each individual with DVR and saw about 8 hours per month of television content recorded, representing an increase of 22.5% compared to 2008.
Video Consumption in the U.S. in the Third Quarter of 2009
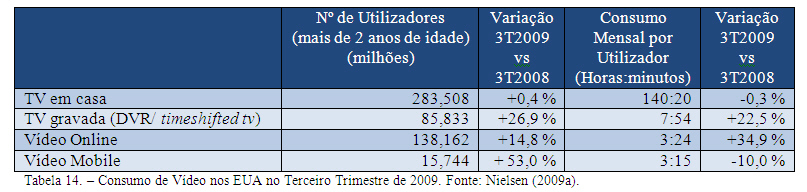
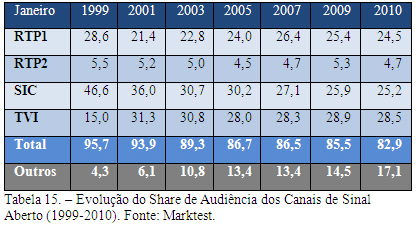
In Portugal, about half of the Portuguese sees on average more than two hours of television per day (Cardoso et al., 2009a). Not always the idea of watching video on a cellphone seemed very attractive to consumers, however, the new era of mobile phones known as smartphones, totally oriented to a user's multimedia experience, have come to change this situation and increase the potential of video equipment in these . The figures for Internet penetration rate in Portugal allow us to understand the potential of video consumption through this platform. According to Eurostat (2009), in 2009, 48% of Portuguese households had Internet access. This value is, however, below the EU average, which stood at 65%. With regard to broadband, the average penetration rate of 46% was observed in Portugal, below the average of 56% registered in the EU (Seybert and Loof, 2009). Multi-tasking Consumers have been using multiple platforms simultaneously. This behavior, called multi-tasking (multi-tasking), occurring particularly in the use of Internet and television. According to Nielsen (2009c), 57% of Americans uses both the Internet and the TV at least once a month. Multitasking is one of the reasons why there is a boom in consumption of television and the Internet. In Portugal there is this phenomenon. According to a survey conducted in 2009 found 68% of Internet users simultaneously perform other tasks such as listening to music, watch TV or use the phone (Cardoso, et al., 2009b). Does not always work on both platforms are decoupled. According to Nielsen (2009d), during the televising of the Oscars, 11% of the audience was simultaneously connected to the Internet. The simultaneous users were online facebook during 76 minutes and 50% more viewing time in the program than the average viewers. The twitter.com reported more than 100,000 messages during the event (Nielsen, 2009d). DTT - Digital Terrestrial Television The distribution of traditional television broadcast is changing with the change of analog broadcasting to digital. DTT / Freeview - digital terrestrial television - allows a reduction from four to ten times, the spectrum needed to broadcast one channel, compared with analogue television. The resulting spectrum can be used to transmit additional channels, is high definition television or mobile TV (Reding, 2008). In the U.S., the conversion to digital television is already finished with the switch-off analog in 2009. In December 2005 the European Union urged member states that the conversion to digital should take place until 2012. Emissions in Portugal began in 2009, and the switch-off scheduled for April 2012 (Anacom, 2009a). DVR - Digital Video Recording The digital video recording has brought a strong contribution to change the paradigm. It consists of the digital recording of programs broadcast by television channels for later viewing, timeshifting functionality known. The recording can be performed using specific equipment, a TV with this capability or integrated into set-top box for pay-TV operators. The timeshifting can still be accomplished using VOD services - video on demand. The video recorder (VCR - video cassette recorder) can be regarded as the first equipment timeshifting. The first device (DVR or PVR - personal video recorder) was introduced by TiVo in 1999 (Corporation for Public Broadcasting, 2005). The DVR equipment have registered a remarkable growth in more developed markets. In the U.S., the penetration of DVR equipment grew by 12.3% in January 2007 to 30.6% in March 2009. The usage profile of users of these devices is variable, about 70% viewed an average of 5 hours of recorded programs a week, while 10% more consumers see an average of 29 hours per week. The majority of recorded programs is displayed especially during prime time and night time. About 30% of the display focuses on the period 8:00 p.m. to 23:00. Most programs written with original issue in prime time is displayed in the space of three days or even the same day they were issued (Nielsen, 2009b). DVR not only contributes to an increase in the program's original audience, but also to a greater loyalty of viewers who can watch their favorite programs when they prefer. Currently U.S. audiences account for the programs recorded and viewed until three days later, and this measure is called by the Nielsen C3 and accepted by advertisers and television (Nielsen, 2009b). The impact of DVR in the audience of the programs differ depending on the type of content. In sporting events broadcast live the impact is very small, but in sitcoms, the audience gets to show an increase of 50% on the audience the original issue, given the view within seven days after the issuance (Nielsen, 2009e). New TV equipment According to data released by Nielsen (2009a), 99% of video content consumed in the U.S. continues to be viewed on TV. This trend will remain. The new TV is connected to the network, becoming an active equipment capable of accessing video content anywhere on the Internet, run their own applications and providing access to sites or specially adapted normal. Leading manufacturers are committed to this paradigm shift. The higher-end equipment already incorporates network connections and implement protocols to connect to other equipment such as DLNA, or Bluetooth. Among other developments on the TV we may note the increased size of the screen, high definition image and the ability to display image in three dimensions. DLNA technology enables connection between the TV and other equipment in the home network. TV Show on a video stored on the phone or pc are a few possibilities. This technology is the responsibility of an international consortium with the same name - DLNA - Digital Living Network Alliance - founded in 2003, and the diversity of business areas of its members, we understand that the future of several instruments, among which includes the TV goes through connectivity and content sharing. Among its 245 members, composed of manufacturers of computers, mobile phones, consumer electronics and software, we find the leading companies in these areas. As a reference is cited here are some: Sony ®, HP ®, Nokia ®, Intel ®, Cisco ® and Microsoft ® (DLNA, 2010). Fragmentation of Audience One of the problems that television broadcasters are facing is the inability to ensure the mass audience and the characteristics desired by advertisers. In the U.S. in 2000, the market share (share) of the FTA channels in prime time was 54%. In 2005, just five years, had fallen to 43.5% (Sales and Gluck, 2008). The emergence of cable television channels and their proliferation threatened the stability of the business of television signal open. In 1995, advertising revenues of TV networks amounted to U.S. $ 12 billion USD while the advertising revenue from cable channels accounted for only USD $ 5 billion. Ten years later, the ad revenue from cable channels had already exceeded the open signal channels, with revenues of $ 18 billion versus $ 16 billion USD (Gluck and Sales, 2008). The increasing availability of television has led to a fragmentation of the audience, with consequences in market share and revenues of the television signal open. Also in Portugal we can see the fragmentation of the audience. According to data from Anacom (2010), over the past years, the trend in the number of households with subscription television service and, consequently, greater availability of channels has grown significantly. No 4. Quarter of 2009, 45.2% of Portuguese households had subscription television. Has evolved in the opposite direction the market share (share) of the FTA channels. In the higher social classes and in the age groups under 44 years, all the subscription channels already registers, usually a share higher than any of the FTA channels. The following graph illustrates the breakdown suffered by the broadcasters and the growing penetration of subscription TV services: 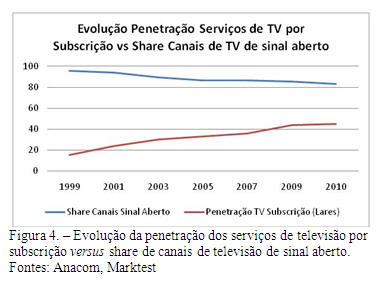
|
|
||||||||||||

nunofonseca.com - All rights reserved.